Imagine it’s a cold April night in 1912, and the RMS Titanic, a marvel of human engineering, is embarking on its maiden voyage from Southampton to New York City. Aboard are over 2,200 passengers and crew members, representing a cross-section of early 20th-century society. From the wealthiest industrial magnates to humble emigrants dreaming of a new life in America, the Titanic is a floating microcosm of the world.

But as the ship sails through the icy waters of the North Atlantic, it strikes an iceberg, leading to one of the most infamous maritime disasters in history. The tragedy claimed the lives of more than 1,500 people, and in its wake, it left a poignant question: Who had the best chance of survival?
Fast forward to the present day. You are a data scientist, part historian and part detective, tasked with solving this century-old mystery. Your tools are not ropes and pulleys but algorithms and data. You have been given access to a treasure trove of information about the Titanic’s passengers: their ages, genders, ticket classes, and more.
This is not just a data science problem; it’s a journey through time. It’s about understanding the human stories behind the numbers, recognizing patterns of survival, and uncovering insights that were lost to the icy depths. As you delve into this project, you’ll be stepping into the shoes of a historical detective, using the power of modern technology to shed new light on an old tragedy.
Are you ready to embark on this journey? Let’s set sail into the world of data, where each row tells a story, and each prediction brings us closer to understanding the human drama of the Titanic. Together, we’ll uncover the secrets of survival, one data point at a time.
Collecting Data as a Data Scientist
As a data scientist, your journey begins with gathering the essential pieces of your puzzle: the data. In the realm of data science, the quality and relevance of your data are paramount. Here’s an overview of the methods data scientists commonly use to collect data:
1. Open Data Repositories
One of the richest sources of data is open data repositories. These are databases where organizations, governments, and research institutions publish datasets for public use. Websites like Kaggle, UCI Machine Learning Repository, and data.gov are treasure troves for data scientists.
- Example: The Titanic Kaggle competition provides a curated dataset, eliminating the need for initial data collection and allowing you to focus on analysis and modeling.
2. APIs (Application Programming Interfaces)
APIs allow data scientists to fetch data programmatically from various services. Many companies and organizations offer APIs to access their data. For instance, social media platforms like Twitter and Facebook provide APIs for fetching data on user posts, likes, and shares.
- Example: If you were to enhance your Titanic analysis with weather data on the night of the sinking, you might use a historical weather API to gather this information.
3. Web Scraping
When data is not readily available through an API, web scraping can be an effective technique. This involves writing scripts to extract data from websites. Tools like BeautifulSoup and Scrapy in Python make web scraping manageable.
- Example: If additional Titanic passenger lists or articles were only available on certain websites, you could scrape this information to enrich your dataset.
4. Databases
Data scientists often access data stored in databases. This involves querying databases using SQL (Structured Query Language) to retrieve the necessary data. Companies usually store their operational data in databases, making this method essential for many business applications.
- Example: If you were working within a company that had historical maritime records, you could query their database to get data on passenger manifests and ship logs.
5. Surveys and Sensors
For primary data collection, surveys and sensors are invaluable. Surveys allow you to collect data directly from individuals, while sensors can collect environmental data. This method is particularly useful when existing data is not available or needs to be specific to a particular research question.
- Example: If you were conducting a study on passenger experiences, you might create a survey to gather firsthand accounts from Titanic historians or descendants of passengers.
6. Collaboration and Partnerships
Collaborating with other organizations or institutions can provide access to data that is not publicly available. Partnerships can be particularly useful in academic and industrial research.
- Example: Partnering with a maritime museum could grant you access to rare artifacts and documents related to the Titanic, providing unique insights into the passengers’ stories.
The Titanic Dataset: Ready for Exploration
In the case of the Titanic Kaggle competition, the data is conveniently curated and ready for us to explore. This saves us significant time and effort.
To dive into the Titanic dataset and begin your data science journey, follow these steps using the Kaggle Notebook environment:
- Sign Up on Kaggle: If you haven’t already, create an account on Kaggle.
- Find the Titanic Competition: Navigate to the Titanic: Machine Learning from Disaster competition page.
- Fork the Kaggle Notebook:
- On the competition page, go to the “Notebooks” tab.
- Find a relevant notebook or start a new one by clicking on “New Notebook.” This will open the Kaggle Notebook environment where you can run your code directly without needing to download anything to your local computer.
- Load the Dataset in Kaggle Notebook.
- The Titanic datasets (
train.csvandtest.csv) are readily accessible within the Kaggle environment. - Use Python and Pandas to load and explore the data directly in the Kaggle Notebook.
- The Titanic datasets (
By performing these steps, you have successfully collected your data, transforming raw historical records into a structured dataset ready for analysis.
To begin our analysis, open our Kaggle Notebook and run the initial code to load the dataset. We create two data frames, train_df and test_df, using the following code:
train_df = pd.read_csv('/kaggle/input/titanic/train.csv')
test_df = pd.read_csv('/kaggle/input/titanic/test.csv')
We can take a look at these data frames by running:
train_df.head()
test_df.head()
As observed, the train_df contains the ‘Survived’ column, whereas the test_df does not.

This absence is because the test_df is used for making predictions and does not include the target variable.
The Purpose of Splitting Data into Training and Testing Sets
In a data science project, the existence of two distinct datasets, one with the target variable and one without it, is a common and purposeful setup. This practice ensures that our models can generalize well to new, unseen data and are not just memorizing the training examples.
Why Split the Data?
After collecting data, it is crucial to split it into at least two sets: a training set and a testing set. This split is fundamental for the following reasons:
- Model Training:
- The training dataset (
train_df) includes the target variable—’Survived’ in this case—which is the outcome we aim to predict. This dataset is used to teach our machine learning model by allowing it to learn from historical data. The model examines the relationships between the features (like age, fare, and class) and the target variable to understand what factors contribute to survival on the Titanic.
- The training dataset (
- Model Evaluation:
- The testing dataset (
test_df) does not include the target variable. This is intentional and serves a crucial purpose in the model evaluation process. Once our model is trained, we use the testing dataset to make predictions. Since the true outcomes (whether the passengers survived or not) are not provided in this dataset, it simulates a real-world scenario where we need to predict outcomes for unseen data. After making these predictions, we compare them against the actual outcomes (which are known but not included in the dataset we worked with) to assess the model’s performance.
- The testing dataset (
- Preventing Overfitting:
- By splitting the data, we can ensure that our model is not just memorizing the training data but is genuinely capable of generalizing its learning to new, unseen data. Overfitting occurs when a model learns the training data too well, including its noise and outliers, which negatively impacts its performance on new data. A separate testing set helps in detecting and preventing overfitting.
- Real-World Simulation:
- Using a testing set simulates a real-world scenario where the model encounters new data it has never seen before. This helps us evaluate how well our model will perform in practical applications, providing a robust measure of its predictive power.
- Model Improvement:
- By evaluating the model on the testing set, we can identify its weaknesses and improve it iteratively. This feedback loop is essential for refining the model and ensuring its accuracy and reliability.
In a captivating YouTube video, Cassie Kozyrkov sheds light on the dual nature of data points in our data science endeavors.
By splitting our data, we can dedicate one portion to training our models, enabling them to learn patterns and relationships from historical data. Meanwhile, the other portion serves as a testing ground, providing an opportunity to evaluate the model’s performance on new, unseen data.
This approach ensures that our models can generalize well and make accurate predictions in real-world scenarios. With Kozyrkov’s insights in mind, we’re reminded of the critical role that data splitting plays in building robust and reliable predictive models in data science.
Maximizing Insights: The Power of Combining Testing and Training Sets
In any Titanic data science project, one of the critical steps to maximize insights and predictive accuracy is the strategic combination of the testing and training sets. This process offers a plethora of benefits, from enhancing data consistency to streamlining model validation. Let’s delve into why this integration is pivotal and how it can significantly elevate your analysis.
- Holistic Data Analysis: Merging the testing and training sets creates a unified dataset that encompasses all available information about the Titanic passengers. This holistic approach enables a comprehensive analysis, unveiling deeper insights and uncovering hidden patterns that might remain undiscovered when the datasets are analyzed separately.
- Consistency in Preprocessing: Data preprocessing, including handling missing values and encoding categorical variables, is fundamental for building robust machine learning models. Combining the datasets ensures that preprocessing steps are applied consistently across both the training and testing data. This consistency minimizes discrepancies and ensures that the model is trained on properly processed data.
- Feature Engineering and Selection: A combined dataset provides a broader pool of data for feature engineering, allowing for the creation of new features or transformation of existing ones to improve model performance. It also facilitates informed feature selection decisions, as the relevance and predictive power of features can be evaluated across both datasets.
- Model Validation and Evaluation: Accurate validation and evaluation of machine learning models are essential for building reliable predictive models. Combining the datasets enables robust model validation through techniques like k-fold cross-validation, ensuring that the model’s performance metrics reflect its true predictive ability and generalization capability.
- Streamlined Workflow: Working with a single combined dataset simplifies the analytical workflow, reducing complexity and streamlining tasks such as data preprocessing, model training, and evaluation. This streamlined approach enhances efficiency and makes it easier to manage and analyze the data.
Now, let’s dive into the code to combine the testing and training sets using Python and Pandas:
Exploring Titanic Dataset Features
The Titanic dataset encapsulates a wealth of information about the passengers aboard the ill-fated ship. Each feature provides a unique glimpse into the demographics and circumstances surrounding the passengers. To illustrate this, let’s take a closer look at one of the passengers, Lily May Peel, also known as Mrs. Jacques Heath Futrelle.
Lily May Futrelle’s journey on the Titanic is a poignant chapter in the ship’s history. She was a first-class passenger, reflecting her high socio-economic status. The dataset records her as a female, aged 35 at the time of the voyage. The “SibSp” feature shows she was traveling with one sibling and the “Parch” feature, with a value of 0, indicates she had no parents or children with her.
Traveling with her husband, Jacques Futrelle, they boarded the Titanic in Southampton. Their ticket number, 113803, and the fare they paid, £53.1, are indicative of the luxurious accommodations they enjoyed. They stayed in cabin C123, located in a prime area of the ship, which likely offered better access to lifeboats.
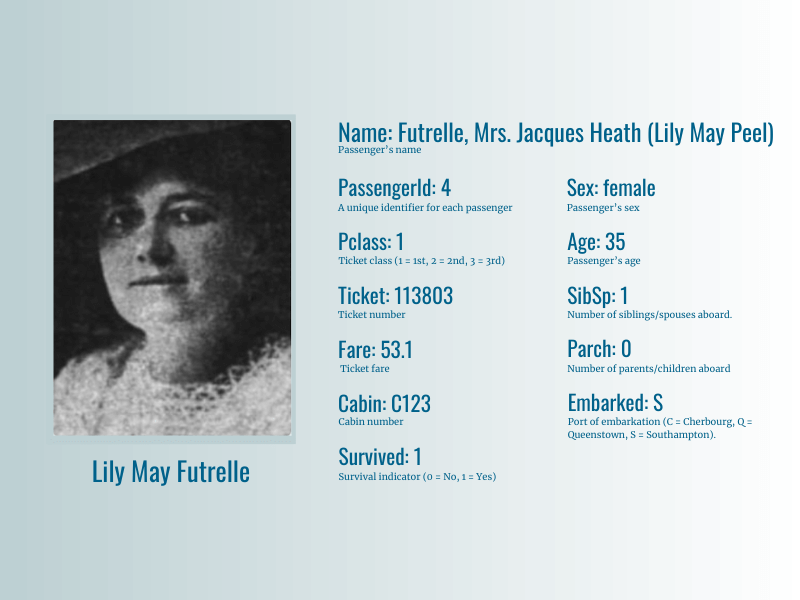
Lily’s story, extracted from these data points, provides a richer understanding of the demographics and circumstances that influenced survival on the Titanic. Her high socio-economic status, reflected in her ticket class and fare, along with her gender, played crucial roles in her survival. The combination of these factors offers a compelling example of how individual passenger data can illuminate broader trends and patterns in the Titanic tragedy.
Let’s analyse each feature separately.
1. PassengerId – a unique identifier assigned to each passenger. This unique identifier allows us to differentiate between individual passengers. While inherently not predictive, it enables tracking and analysis of individual passengers’ data.
2. Survived – an indicator of survival, where 0 represents “did not survive” and 1 represents “survived”. This feature is present only in the training dataset, serving as the target variable for predictive modeling. As the target variable, Survived indicates whether a passenger survived the Titanic disaster (1) or not (0). Exploring survival rates across different demographic groups provides crucial insights into factors influencing survival.
3. Pclass – ticket class indicating the socio-economic status of the passenger (Values: 1 = First class, 2 = Second class, 3 = Third class). Ticket class reflects passengers’ socio-economic status, with 1st class indicating higher status and 3rd class representing lower status. Analyzing survival rates by ticket class reveals disparities in survival probabilities across socio-economic strata.
4. Name – the name of the passenger, including titles such as Mr., Mrs., Master, etc. While primarily a categorical feature, names can offer insights when parsed for titles (e.g., Mr., Mrs., Miss). These titles may correlate with socio-economic status or gender, providing additional context for analysis.
5. Sex – gender of the passenger, categorized as male or female. Gender plays a significant role in survival dynamics, with societal norms influencing evacuation priorities. Analyzing survival rates by gender sheds light on potential gender-based disparities in survival.
6. Age – age of the passenger in years. This feature may contain missing values. Age distribution among passengers provides insights into demographics and may correlate with survival probabilities. Exploring age groups and survival rates uncovers age-related trends in survival dynamics.
7. SibSp – number of siblings or spouses aboard the Titanic. The number of siblings/spouses aboard can indicate family size and support networks. Analyzing survival rates by SibSp reveals how familial relationships influenced survival probabilities.
8. Parch – number of parents or children aboard the Titanic. Similarly, the number of parents/children aboard reflects family dynamics. Analyzing survival rates by Parch uncovers how parental responsibilities affected survival probabilities.
9. Ticket – ticket number assigned to the passenger. Ticket numbers may contain alphanumeric codes or patterns indicative of ticket types or purchase locations. Analyzing ticket features can provide insights into ticketing systems and passenger origins.
10. Fare – the fare paid by the passenger for the ticket. Fare paid for tickets reflects passengers’ purchasing power and ticket class. Exploring fare distributions and survival rates by fare brackets illuminates socio-economic disparities in survival.
11. Cabin – cabin number where the passenger stayed. This feature may contain missing values. Cabin numbers may correlate with cabin locations on the ship, influencing proximity to lifeboats and evacuation routes. Analyzing survival rates by cabin location provides insights into spatial dynamics of survival.
12. Embarked – port of embarkation for the passenger (Values: C = Cherbourg, Q = Queenstown, S = Southampton). Port of embarkation reflects passengers’ embarkation locations and potentially their socio-economic backgrounds. Analyzing survival rates by embarkation port reveals regional disparities in survival probabilities.
Exploring these features offers valuable insights into the demographics, socio-economic status, and familial relationships among Titanic passengers. Understanding the nuances of each feature is crucial for data preprocessing, visualization, and model building in the quest to uncover patterns of survival.
After a thorough analysis of each feature, we have gained valuable insights into the Titanic dataset. Now, armed with this understanding, it’s time to dive deeper into the actual data using Python within a Jupyter notebook environment.
Python, with its powerful libraries such as Pandas, NumPy, and Matplotlib, provides us with the tools needed to explore, visualize, and analyze the dataset comprehensively. By leveraging these tools, we can uncover hidden patterns, correlations, and trends within the data.
In the upcoming sections, we will walk through loading the Titanic dataset into a Jupyter notebook, performing data preprocessing tasks, visualizing key features, and building predictive models to tackle the challenge posed by the Titanic Kaggle competition.
Let’s embark on this journey of data exploration and analysis, as we uncover the stories hidden within the Titanic dataset and strive to build predictive models that shed light on the fate of its passengers.